With the increasing popularity of new energy vehicles, the power battery industry has also become hot! The Tesla electric car we are familiar with uses a battery panel composed of 18650 lithium-ion batteries in series and parallel.
Let’s take a look at the production process of lithium batteries
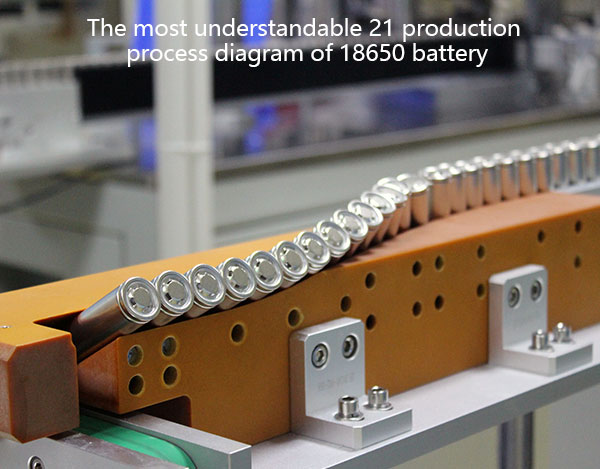
The most understandable 21 production process diagram of 18650 battery.
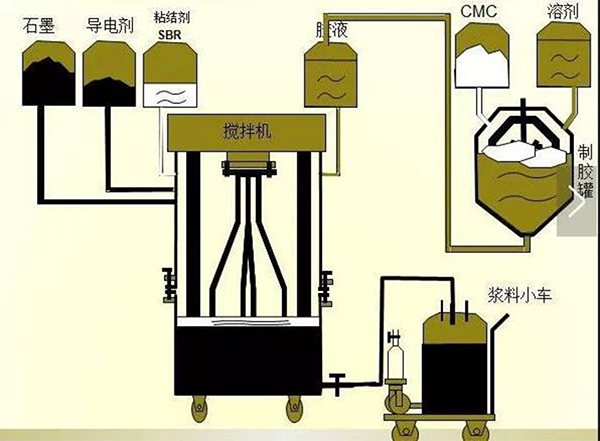
Negative homogenate
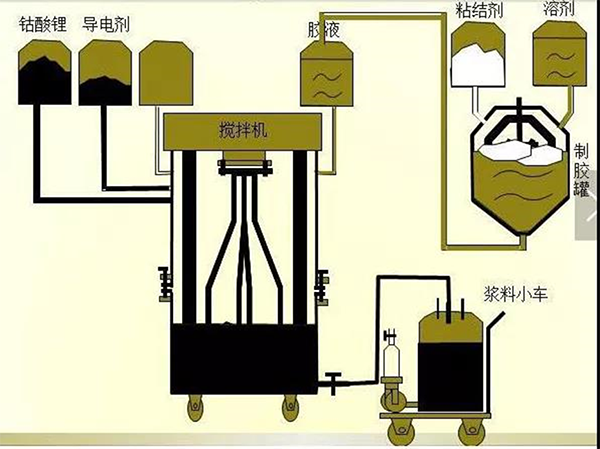
Cathode homogenate
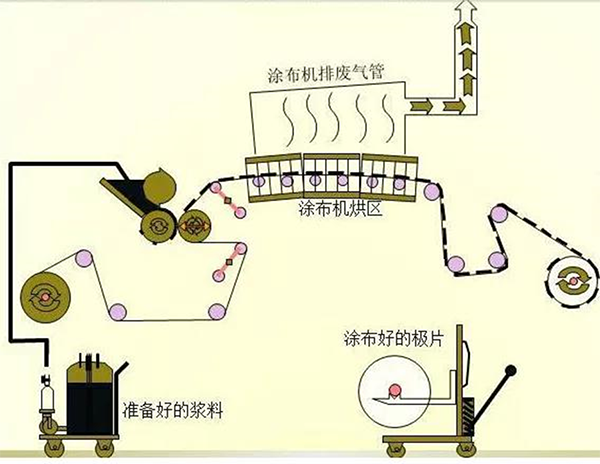
coating
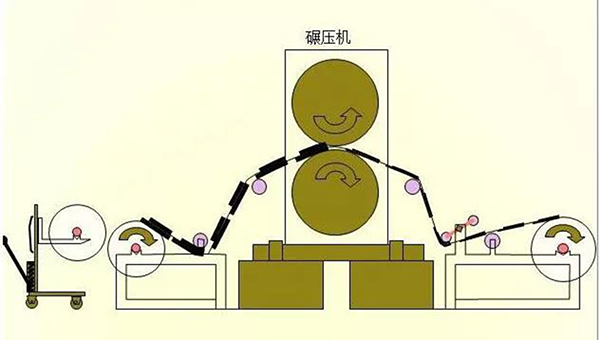
Rolled by roller
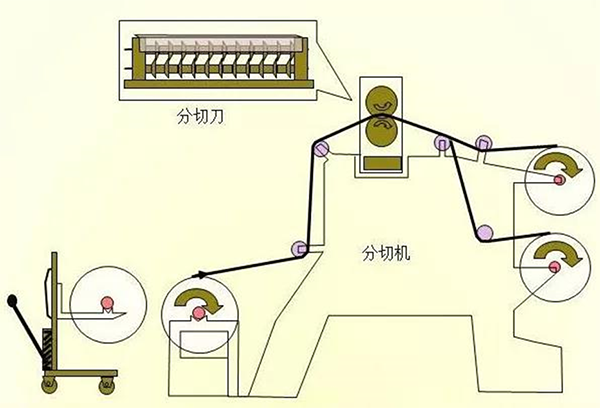
slitting machine
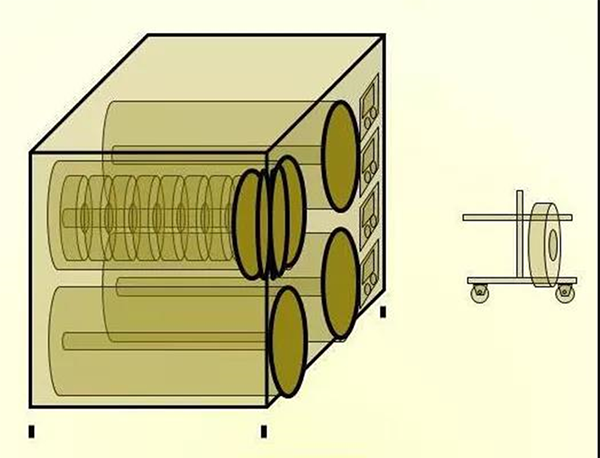
bake
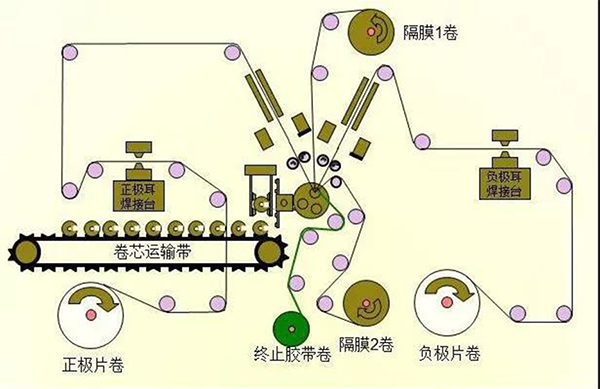
winding
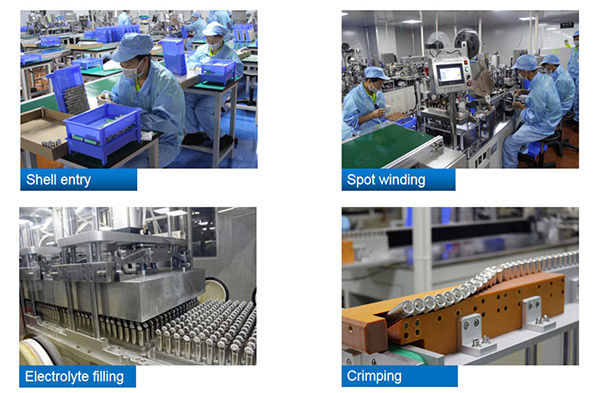
into the shell
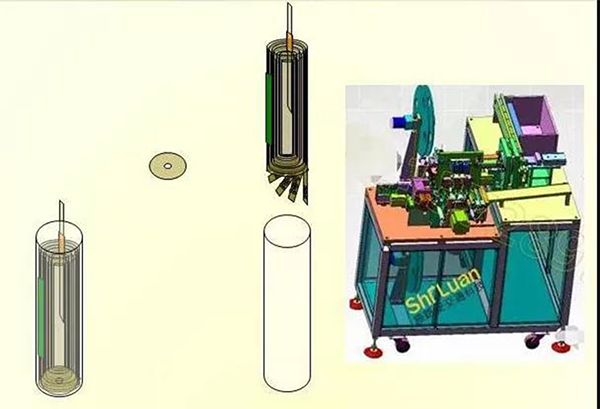
spot welding
bake
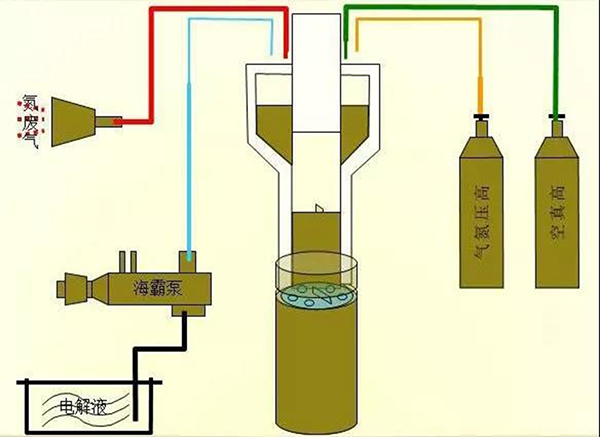
injection
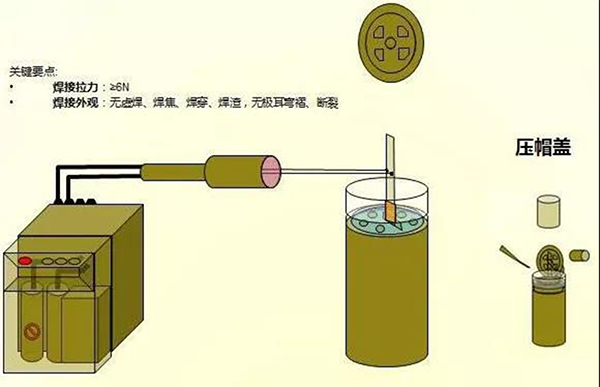
Weld cap
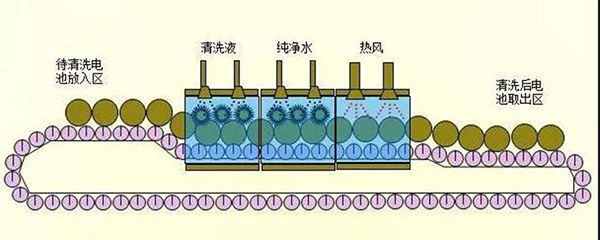
cleaning
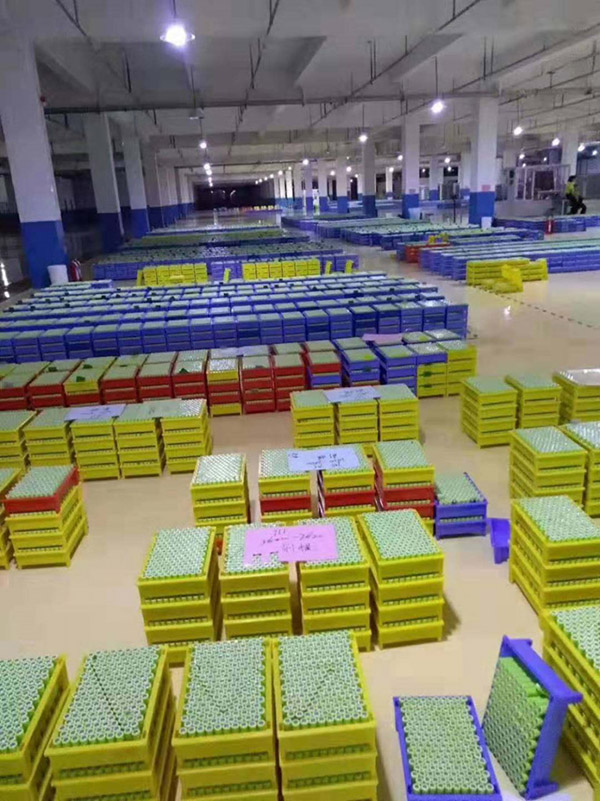
dry storage
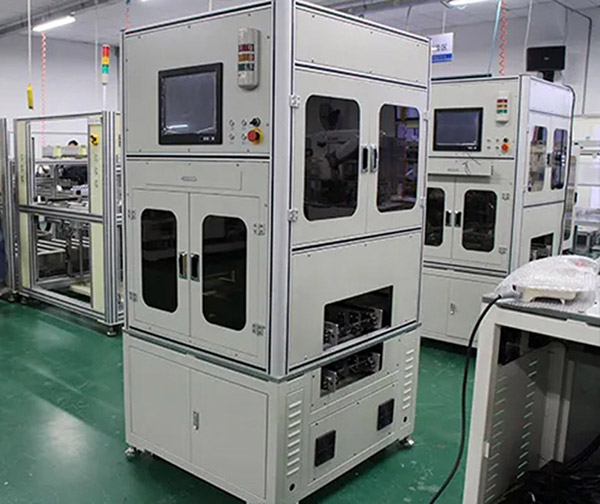
Check alignment
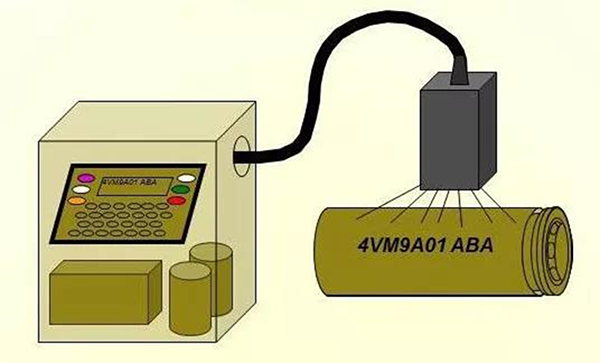
Shell coding

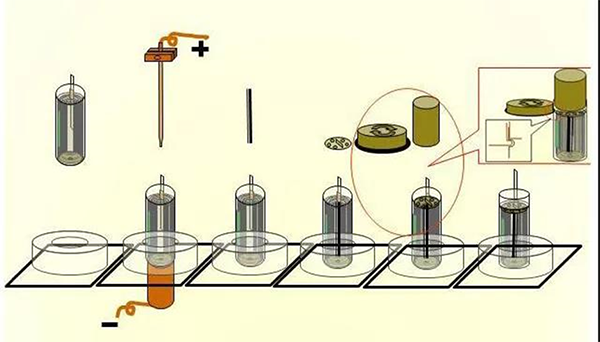
form into
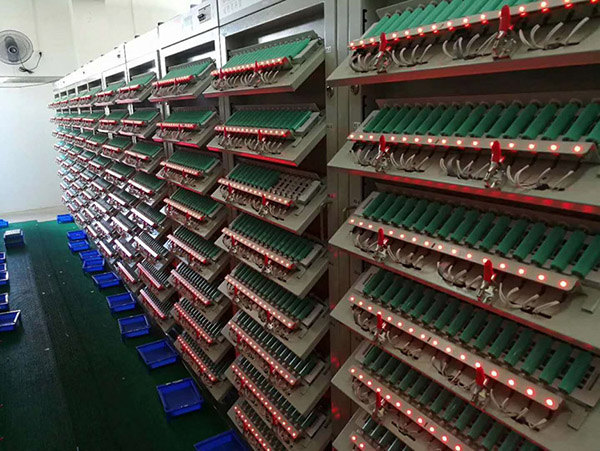
The assembled battery is given a certain current, so that the positive and negative active materials of the battery are excited, and the electrochemical process that finally makes the battery discharge capacity is called chemical formation. The battery can only be used as a power source after chemical formation.
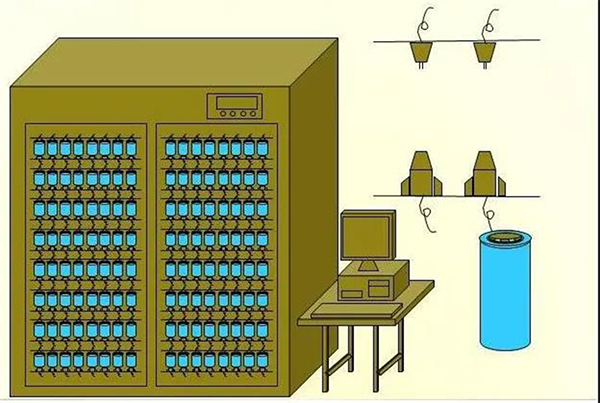
OCV measurement
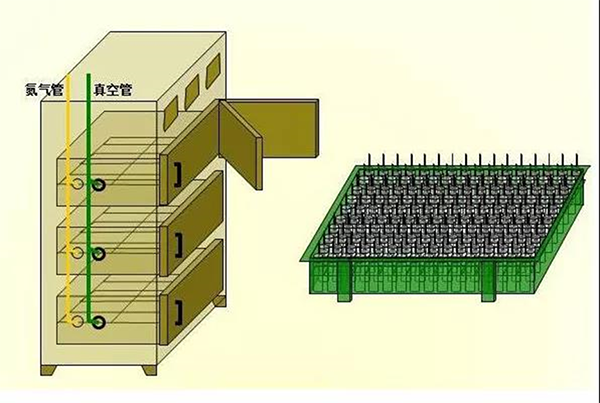
normal temperature storage
divide capacity
During the manufacturing process of the battery, the actual capacity of the battery cannot be completely consistent due to technological reasons. Through a certain charge and discharge test, the process of classifying the battery by capacity is called capacity division.
Final Process
Keheng New Energy’s Range Of Products
- 100AH 12V Low Temperature Heating Enable
- Lithium Battery Cell
- Lithium Battery Pack
- Escooter/Ebike Battery
- 12V/24V Lifepo4 Battery
- Portable Power Station
- ESS Energy Storagy Systems
- Deep Cycle Batteries With BMS
- Low Temperature 24V 60AH Battery


