During the use of lithium-ion batteries, the actual available capacity, relative to the rated capacity at the factory, will continue to decrease, that is, capacity decay occurs. Any side reaction capable of consuming lithium ions can lead to a change in the lithium ion balance in the battery, which is irreversible and can accumulate over multiple cycles, thereby adversely affecting battery performance.
Charging and discharging a battery once is called a cycle, and the cycle life is an important indicator of battery life performance. The root cause of the factors affecting the cycle life of lithium-ion batteries is that the number of lithium ions involved in energy transfer is constantly decreasing. The total amount of lithium in the battery has not decreased, but the “activated” lithium ions are less, they are imprisoned in some places or the transmission channel is blocked, and they cannot freely participate in the charging and discharging process.

Lithium ion battery cycle data analysis method
Specifically include:
(1) Precipitation of metallic lithium: generally occurs on the surface of the negative electrode. When lithium ions migrate to the surface of the negative electrode, some of the lithium ions do not enter the negative electrode active material to form a stable compound, but instead gain electrons and deposit on the negative electrode surface to become metal lithium, and It no longer participates in the subsequent cycle process, resulting in a decrease in capacity. For example, when overcharged or the negative electrode material is insufficient, the negative electrode cannot accommodate the lithium ions migrated from the positive electrode, resulting in the deposition of metallic lithium; during high-rate charging, due to the excessive number of lithium ions reaching the negative electrode in a short period of time, causing channel blockage and Precipitate.
(2) Decomposition of the positive electrode material: The lithium-containing metal oxide of the positive electrode material will continue to decompose during long-term use, producing some electrochemically inert substances and some flammable gases, destroying the capacity balance between the electrodes and causing the capacity to decrease. irreversible loss.
(3) SEI film on the electrode surface: carbon anode material, during the initial cycle, the electrolyte will form a solid electrolyte (SEI) film on the electrode surface, the formation of the SEI film will consume lithium ions, and the SEI film is not. Stable and constant, it will continue to rupture during the cycle, exposing the new negative electrode surface and then reacting with the electrolyte to form a new SEI film, which will continuously cause the continuous loss of lithium ions and electrolytes, resulting in a decrease in battery capacity. In addition, the diffusion channels of lithium ions in the SEI film may be blocked, which will also cause a decrease in battery capacity.
(4) Loss of electrolyte: in the process of continuous circulation, the electrolyte will continue to decompose and volatilize, resulting in a decrease in the total amount of electrolyte, which cannot fully infiltrate the positive and negative materials, and the charge-discharge reaction is incomplete, resulting in the actual use capacity. Decline. In addition, if there is a certain amount of water in the electrolyte, the water will chemically react with LiFP6 to produce LiF and HF, which in turn destroys the SEI film, generating more LiF, causing LiF deposition, and continuously consuming active lithium ions. Decreased battery cycle life.
(5) Diaphragm blockage or damage: During the cycle of lithium-ion batteries, the gradual drying up and failure of the diaphragm is also a cause of capacity decline. Due to the drying up of the separator, the ohmic internal resistance of the battery increases, resulting in blockage of the charging and discharging channels, incomplete charging and discharging, and the battery capacity cannot be restored to the initial state, which greatly reduces the capacity and service life of the battery.
(6) The positive and negative materials fall off: the active materials of the positive and negative electrodes are fixed on the substrate by the binder. During long-term use, due to the failure of the binder and the mechanical vibration of the battery, the positive and negative electrodes are The active material of the battery is constantly falling off and entering the electrolyte solution, which leads to the continuous reduction of the active material that can participate in the electrochemical reaction, and the cycle life of the battery is continuously reduced. The long-term stability of the binder and the good mechanical properties of the battery will be able to delay the decline in the cycle life of the battery.
At present, the test methods used to evaluate the life of lithium-ion batteries are generally tested through continuous charging and discharging cycles, which require a long test cycle. The cycle life requirements and test methods are generally specified in lithium-ion battery standards. In the existing domestic lithium-ion battery standards, the test requirements for the cycle life of lithium-ion batteries are shown in Table 1.
The cycle life test will generate a large amount of data, which can obtain a lot of information. What analysis and processing can we do to these cycle data? The following summarizes some of the data processing methods reported in the literature for cyclic collection. Please correct me if I misunderstand.
Charge and discharge curve
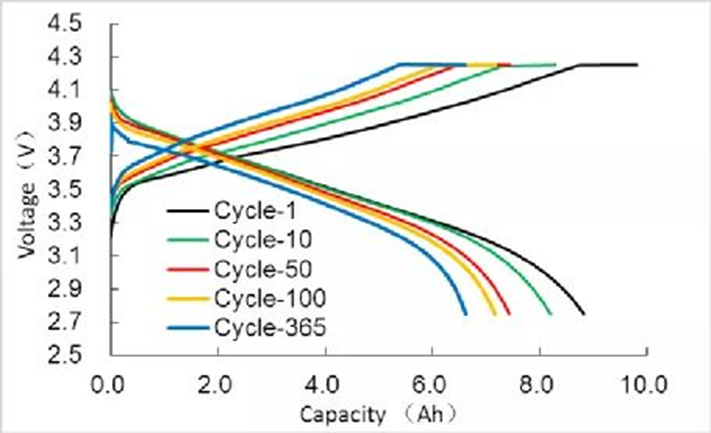
The charge-discharge curve refers to the curve of the voltage, current, capacity, etc. of the battery changing with time during the charging and discharging process of the battery. The information contained in the charge-discharge curve is very rich, including capacity, energy, operating voltage and voltage platform, the relationship between electrode potential and state of charge, etc. The main data recorded during the charge-discharge test is the time evolution of current and voltage. Many parameters can be obtained from these basic charge-discharge data of batteries that have undergone different cycles. The subsequent analysis is basically based on data extracted from the charge-discharge curve. process of analysis. A typical cycle charge-discharge curve is shown in Figure 1. As the cycle progresses, the battery capacity decays and the charge-discharge curve changes.
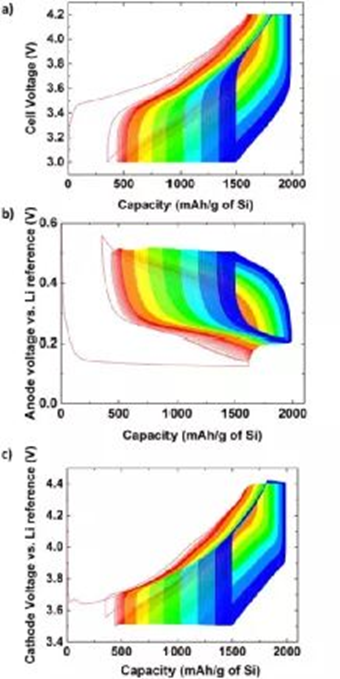
In order to see the change of the charge-discharge curve more intuitively, the ordinary charge-discharge curve can also be made into a curve of the cumulative capacity. From the first charge, the abscissa is the capacity or specific capacity, the discharge capacity takes the charge capacity as the starting point, and the discharge capacity is Negative values, gradually decrease. After each step, the capacity of the previous step is used as the starting point. When charging, the capacity is positive and gradually increases; when discharging, the capacity is negative and gradually decreases. Combined with the change of the color of the curve, the charge-discharge curve made during the cycle is shown in Figure 2.
Charge and discharge coulombic efficiency
Coulomb efficiency, also called charging efficiency CE, refers to the ratio of battery discharge capacity to charging capacity during the same cycle, that is, CE= Discharge capacity/ Charge capacity*100%. The amount of electricity input by charging is often not used to convert the active material into a charged state, but is partially consumed (for example, irreversible side reactions occur), so the Coulombic efficiency is often less than 100%. Coulombic efficiency is an important battery parameter that is closely related to the loss of active lithium.
Yang et al. studied the aging process of LFP cells and explored the correlation between Coulombic efficiency (CE) and capacity fading. For the kth cycle, the amount of irreversible lithium qk is:
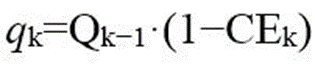
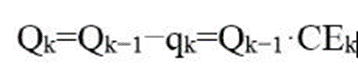
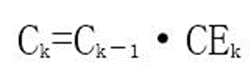
Iterate sequentially, that is:
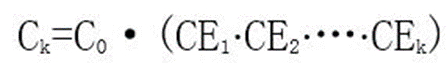
where C0 is the initial capacity of the battery, and the correlation between Coulombic efficiency (CE) and capacity C fade is shown in Figure 3.
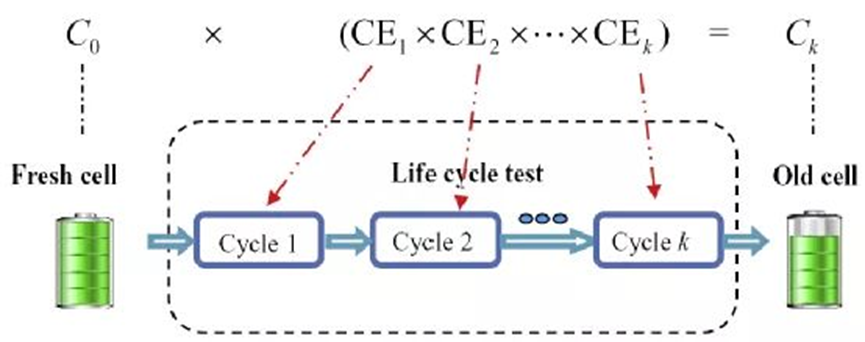
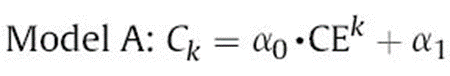
Assuming that the coulombic efficiencies of the batteries are almost equal for each cycle, the formula in Figure 3 can be expressed as Model A:
For comparison, a capacity decay model B with cycle number K as a variable is also proposed:
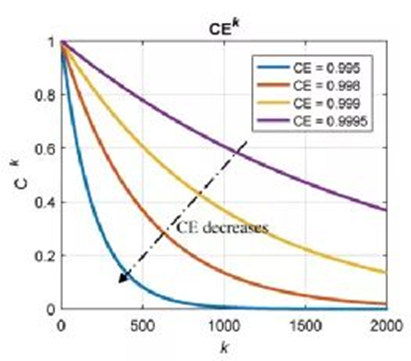
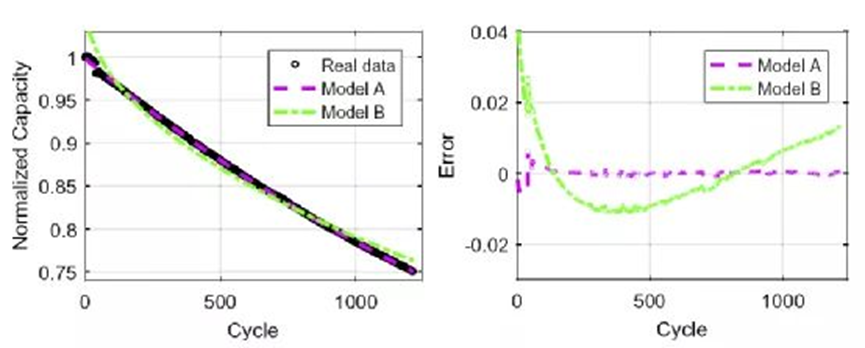
Through the data in the early stage of the battery, the model is fitted to obtain the model parameters α0, α1 and β0, β1, and the capacity decay model of the battery is established. According to Model A, the capacity decay curves corresponding to different Coulombic efficiencies are shown in Fig. 4. As the Coulombic efficiencies decrease, the capacity decays faster. The comparison of the capacity fading predicted by models A and B with the actual data and their errors are shown in Figure 5. The results show that the two models are quite different from the experimental results in the first few cycles, but as the cycles progress, both have good performance. Fitting effect, the root mean square error is small. Model A according to Coulombic efficiency outperforms Model B with smaller rms error.
dQ/dV curve
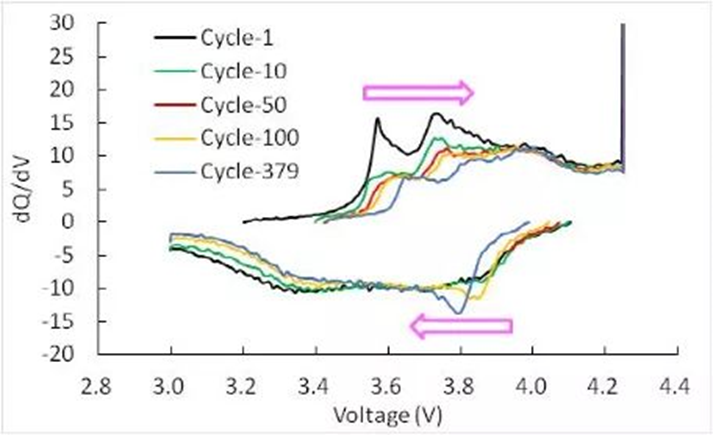
Charge and discharge the lithium-ion battery, and record the charge and discharge parameters, especially the power and voltage data. After obtaining these data, we first process the data. We subtract the voltage and power data of the n+1th data point from the first. n data points voltage and power data, we get a dV and dQ data, processing all the data in turn, we get a series of dV and dQ data, and then we divide dQ by dV to get another one Data dQ/dV, then we use dQ/dV as the ordinate, and voltage, capacity or SoC as the abscissa, we get a standard dQ/dV curve, as shown in Figure 6.
The physical meaning of the dQ/dV curve is also very simple, that is, the capacity contained in the material within the unit voltage range. We all know that there is a voltage platform for the positive and negative materials of lithium-ion batteries, and the negative electrode capacity on the voltage platform is Higher, which means that there is a lot of capacity within a small voltage fluctuation range, so it is a characteristic peak on the dQ/dV curve. Usually we think that each peak on the dQ/dV curve represents a Electrochemical reactions, due to the different reaction potentials of different materials, the position and height of the peaks in the dQ/dV curve will also be different.
The dQ/dV curve mainly reflects the phase transition of the positive and negative active materials during charging and discharging. According to the data of the battery, we can find out the phase transition corresponding to the different characteristic peaks in the dQ/dV curve, and then according to the dQ/dV in the cycle The trend of the change of the curve (Figure 6) allows us to qualitatively infer the cause of the loss of reversible capacity of the lithium-ion battery, which provides a reference for the design of the lithium-ion battery.
Constant voltage charging current and time
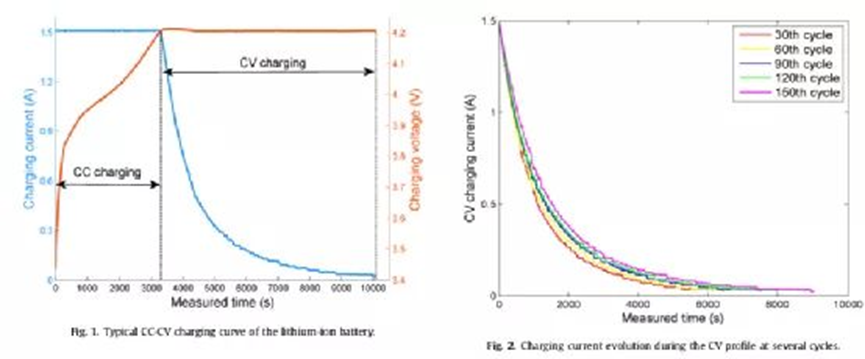
Lithium-ion batteries are usually discharged at different currents during use, and often cannot experience a complete and stable discharge process. This incomplete discharge process affects the subsequent charging process. The battery charging process is generally a cross-current-constant voltage mode CC-CV, which consists of two continuous processes: CC charging and CV charging, with constant current until the battery voltage reaches the nominal maximum voltage. Subsequently, the battery enters the constant voltage charging mode, and the charging voltage remains constant until the charging current gradually decreases to the cut-off current, as shown in Figure 7. Whether the battery is fully discharged or not, the dynamic characteristics of the CV stage can well reflect the health information of the battery. In addition, the charging data in the CV phase can be comprehensively monitored by the BMS. Therefore, the kinetics of CV charging can be used to study the battery aging law.
During the charging process of the battery, with the progress of CC charging, the lithium ions inside the electrode material migrate from the positive electrode to the negative electrode under the action of the load current. The concentration of Li ions in the anode gradually increases with time and reaches a maximum value at the beginning of the CV phase. In the CV stage, as the load current decreases, the lithium ions in the electrolyte gradually intercalate into the negative electrode, and the concentration decreases rapidly. When the CV phase ends, the lithium ion insertion is complete, and the concentration of lithium ions in the anode drops to almost the same level as the cathode. In the CV stage, the loss of active lithium is more common and obvious than that in the CC step, and the literature reports that the loss of active lithium is 5.5% and 94.5% in the CC stage and the CV stage, respectively.
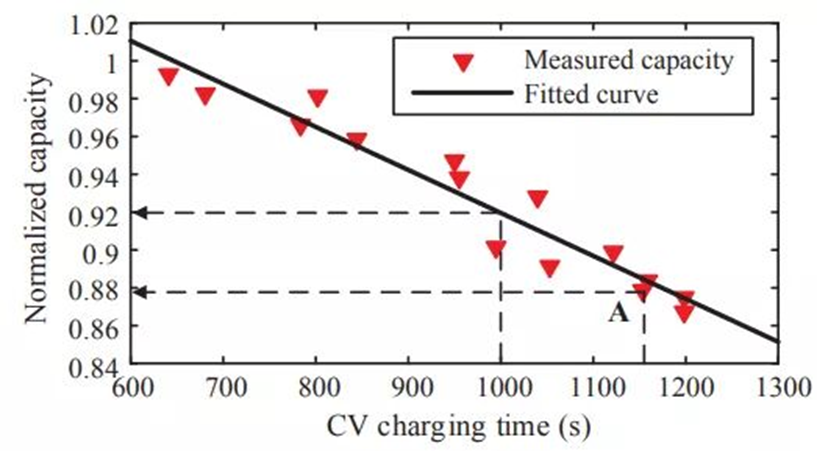
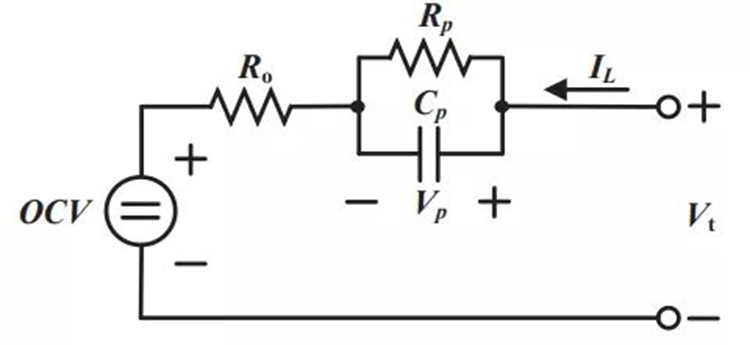
Figure 7 contains CV charge current curves for several different aging states. In the case of cyclic use and continuous active lithium loss, the CV charge time is affected by battery aging, and the curve shapes vary. For example, the 30th cycle battery took less time to complete the CV charge than the 60th cycle battery. In addition, the maximum curvature of the current curve decreases as the battery health deteriorates, and the value of the CV charge capacity is not equal between the different curves. These phenomena indicate that the shape of the charge current curve during CV charging changes with the battery SOH. For example, as shown in Figure 8, the lateral pressure charging time and the cycle capacity have a monotonically decreasing linear relationship, but in practical applications, some batteries cannot reach the cut-off current value due to the incomplete charging process. In addition, noise interference on the current measurement can also cause the battery to complete the CV cycle prematurely. Either of the above two cases will affect the constant voltage charging time compared to the full CV charging process.
Since the current rate of change during constant voltage charging is closely related to the associated time constant, the current time constant of the CV charge cycle can be used to study the battery aging state. The equivalent circuit of the battery is shown in Figure 9, and the constant voltage charging current curve at tk+1 can be expressed as:

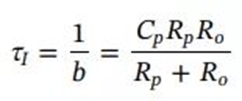
In the formula, IL and Vt can be directly measured, and VOC can be identified by HPPC test in advance. In addition, the impedance parameters (R0, Rp, and Cp) can be obtained by discrete-time least squares fitting, and then a quantitative correlation model between the battery cycle capacity Cn and the constant-voltage charging time constant τI can be established to predict the battery SoH .
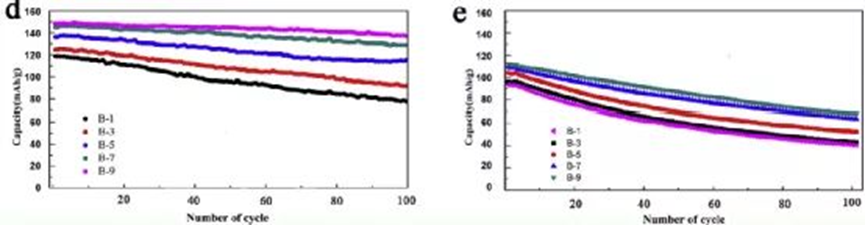
capacity decay curve
The capacity or specific capacity-cycle number curve is an important and most common characterization method to study the failure mechanism of cathode materials, anode materials, electrolytes and batteries. The specific icons are shown in Figure 10. The detailed introduction and analysis methods will not be repeated here.